Dashboards#
The UNLOCK FAIR Data Platform uses Grafana dashboards to visualize incoming data streams. This page outlines the use of Grafana within the platform.
Note
Please note that the features mentioned in this document are in development and as such this page is subject to change.
Documentation:
https://grafana.com/docs/
Live data monitoring#
Grafana is directly connected to the platform’s TimescaleDB data source. This database continuously receives data in real time and as such, Grafana offers the possibility to create live dashboards. To access the Grafana web interface, an UNLOCK project manager will grant you the required permissions to your project-specific Grafana environment. This requires the usage of SRAM, the project manager will send a link to the web interface.
Some users have had issues using the web interface specifically in the Microsoft Edge browser. Google Chrome and Firefox have proven compatibility.
Once access is granted, your project will have a subfolder under your Dashboards in Grafana. Depending on the setup, some pre-existing dashboards might be directly nested under the subfolder to which users will have read-only access. A subfolder named Playground is fully accessible to the user, in which dashboards can be custom-tailored (this feature is currently reserved for the UNLOCK affiliated platforms).
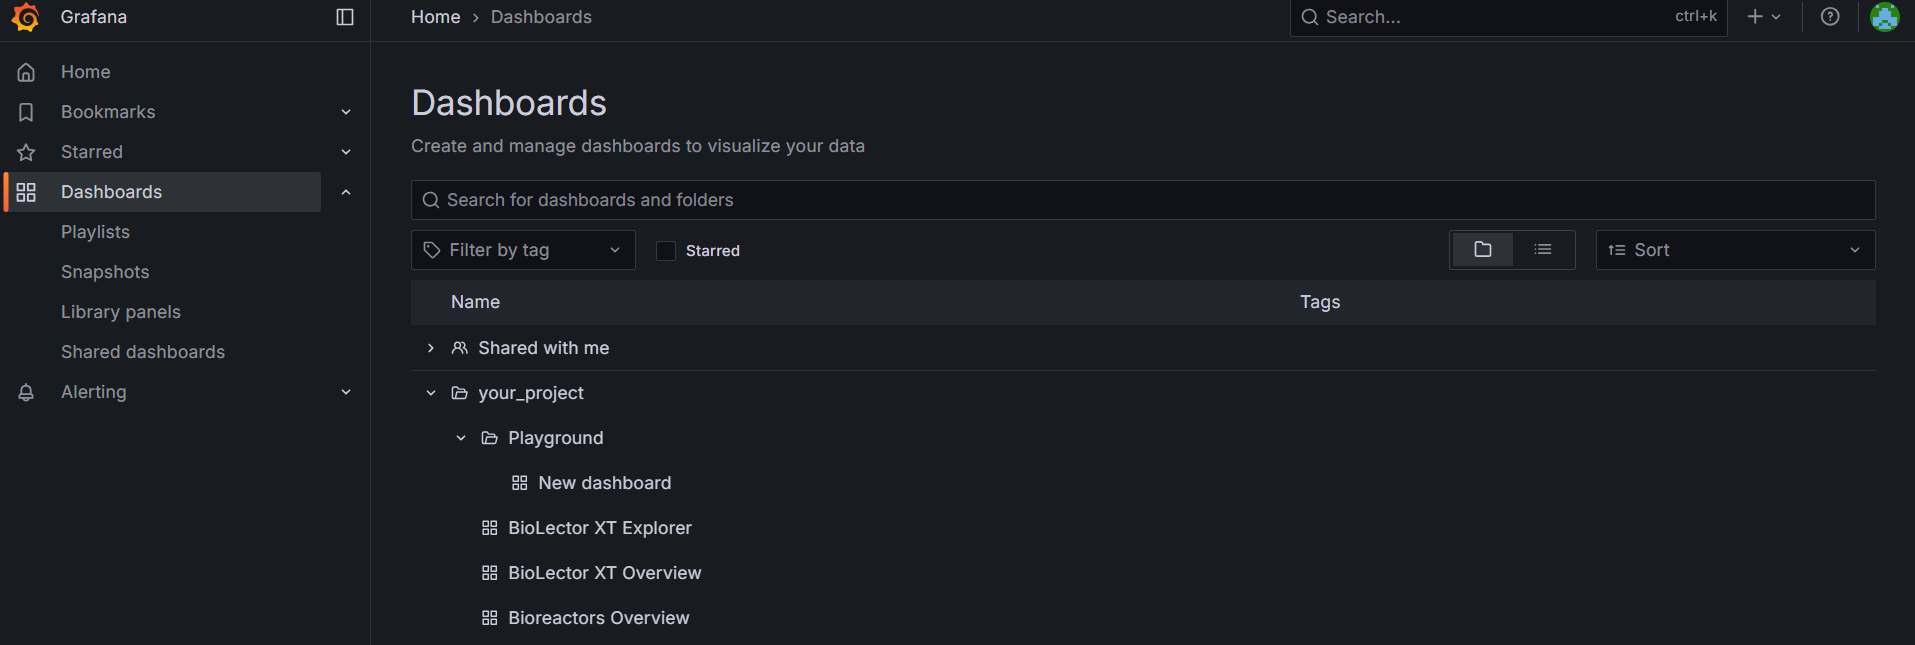
Create your own dashboards#
To create your own dashboard, navigate to a fully accessible folder, press the + button on the top right and click New dashboard. Here, you can import pre-existing dashboards or add your own visualization. Select timescaledb as the data source (default) and a new dashboard with its first panel will open. The Time series visualization type fits in most cases, but there are many different types to choose from.
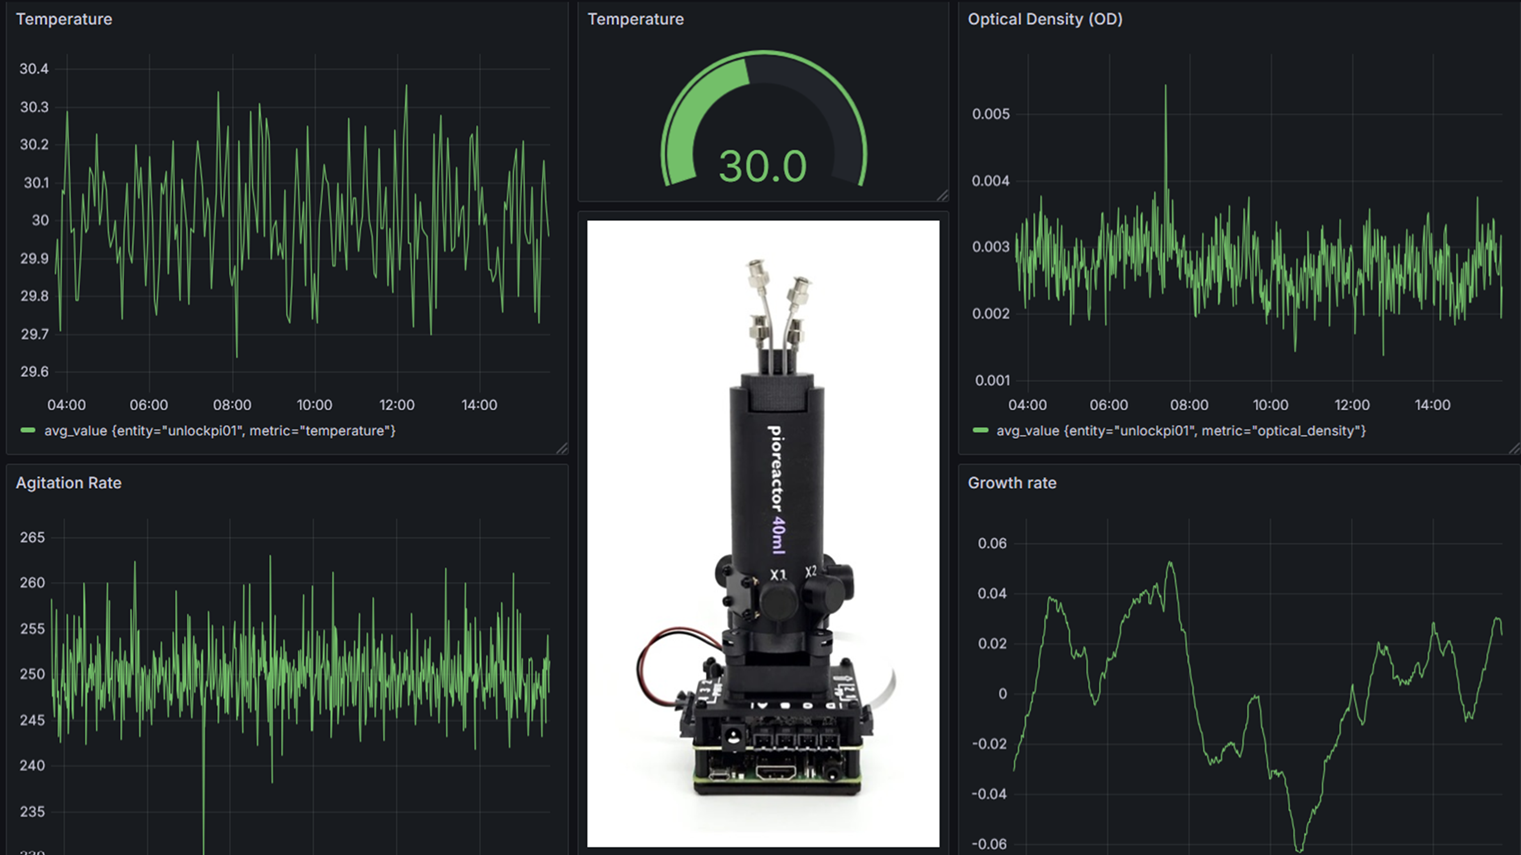
In Grafana, data must be queried by using the query language corresponding to its data source. As we are using TimescaleDB, which is an extension of postgreSQL, this language is SQL (Structured Query Language). A handy query Builder is selected by default to help out those with less familiarity with the relevant query language. If you are comfortable using SQL, you can select the Code section and directly paste your queries. Be mindful to select the Time series Format. It can also be convenient to work with variables, which can elevate your dashboards to an interactive level. Refer to the image below for a static example of a pioreactor dashboard.
Alert rules#
The FDP has a mail server that can be used with Grafana’s alert system. It is possible to set up a system that automatically tracks values crossing certain thresholds. This enables you to be informed about possible incidents or outages.
If you would like to set up alerts, consider the conditions that should trigger them and contact an UNLOCK project manager for assistance.